Multiple Choice
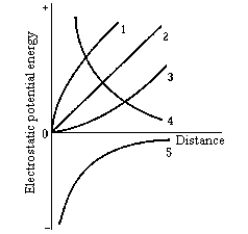 Which of the curves in the graph represents the electrostatic potential energy of a small negative charge plotted as a function of its distance from a positive point charge?
A) 1
B) 2
C) 3
D) 4
E) 5
Correct Answer:
Verified
Related Questions
Q63: Use the following figure to answer the
Q64: Use the following figure to answer the
Q70: An electric charge q is placed on
Q71: Use the following figure to answer the
Q78: Use the following figure to answer the
Q80: Dielectric breakdown occurs in the air at
Q83: Which of the following statements is false?
A)The
Unlock this Answer For Free Now!
View this answer and more for free by performing one of the following actions

Scan the QR code to install the App and get 2 free unlocks

Unlock quizzes for free by uploading documents