Multiple Choice
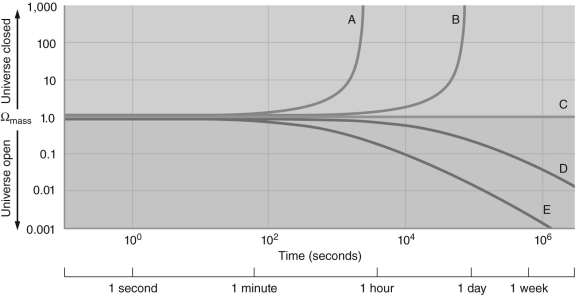 Figure 2
-Figure 2 shows a graph of the value of mass as a function of time in a universe with no dark energy. The five different curves correspond to universes with slightly different values for mass one second after the Big Bang. Which line corresponds to a universe with the smallest value of mass one second after the Big Bang?
A) A
B) B
C) C
D) D
E) E
Correct Answer:
Verified
Related Questions
Q42: The universe can be infinite in size
Q43: In order to produce an electron
Q44: To verify whether or not some grand
Unlock this Answer For Free Now!
View this answer and more for free by performing one of the following actions

Scan the QR code to install the App and get 2 free unlocks

Unlock quizzes for free by uploading documents