Which of the graphs below best illustrates the number of species planted in the Tijuana Estuary habitat restoration studies, as well as the degree of restoration achieved (as measured by the proportion of the ground covered by plants) ? 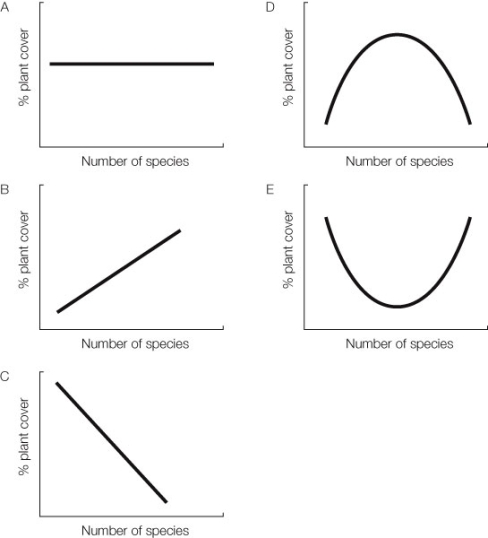
A) Graph A
B) Graph B
C) Graph C
D) Graph D
E) Graph E
Correct Answer:
Verified
Q71: The native vegetation of the Western Cape
Q72: In the United States, the groups of
Q73: Use the following to answer questions :
Refer
Q74: The concepts of conservation biology come mainly
Q75: In the Hawaiian Islands, the blood disease
Q77: The Plimsoll line
A) helped reestablish the California
Q78: Based on species-area relationships, ecologists predict that
A)
Q79: Species that are threatened by extinction in
Q80: The practice of using exploited lands in
Q81: What are wildlife corridors, and how have
Unlock this Answer For Free Now!
View this answer and more for free by performing one of the following actions

Scan the QR code to install the App and get 2 free unlocks

Unlock quizzes for free by uploading documents