In the graph below, select the curve (a, b, or c) that correctly shows the expected relationship between habitat patch area and the proportion influenced by edge effects. 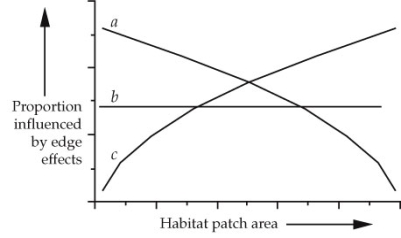
Correct Answer:
Verified
Q92: Which of the following efforts to preserve
Q93: Experiments on wetland restoration have demonstrated that
Q94: Why do conservation biologists believe that global
Q95: Which of the following statements about elephants
Q96: The California condor
A) is being introduced into
Q98: The fynbos shrub community in South Africa
A)
Q99: Which of the following threaten species survival?
A)
Q100: A defect of the "hotspot" approach to
Q101: A species that is found only in
Q102: Which of the following factors are used
Unlock this Answer For Free Now!
View this answer and more for free by performing one of the following actions

Scan the QR code to install the App and get 2 free unlocks

Unlock quizzes for free by uploading documents