In the graph below, which of the following represents (1) the curve that describes the changes in ratio of nuclear volume to cytoplasmic volume during the cleavage stage of development; and (2) the correct statement about the changes in size of the blastomeres during that stage? 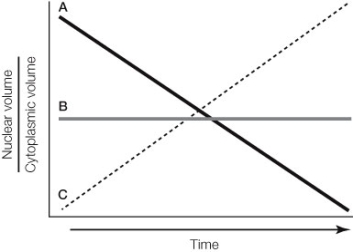
A) Curve A; blastomeres decrease in size
B) Curve B; blastomeres decrease in size
C) Curve C; blastomeres decrease in size
D) Curve A; blastomeres increase in size
E) Curve C; blastomeres increase in size
Correct Answer:
Verified
Q98: Exposure to toxins is particularly dangerous to
Q99: The region of the frog egg that
Q100: _ are essential transcription factors to the
Q101: Refer to the diagram below. What is
Q102: Refer to the diagram below, showing
Q104: The period of human gestation is also
Q105: Which of the following statements about the
Q106: A fate map can be used to
Q107: Which of the following statements about the
Q108: Which of the following statements about the
Unlock this Answer For Free Now!
View this answer and more for free by performing one of the following actions

Scan the QR code to install the App and get 2 free unlocks

Unlock quizzes for free by uploading documents