The diagram below shows the Dobzhansky-Muller model of the evolution of reproductive isolation. The F1 hybrids between the species at the end of this process have reduced fitness. Which of the following genotypes have reduced fitness? 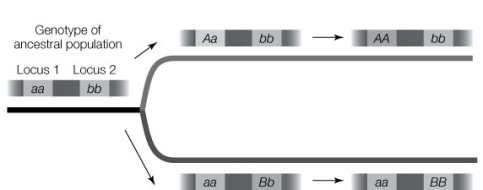
A) aabb
B) AAbb
C) AaBb
D) aaBB
E) None of the above
Correct Answer:
Verified
Q94: When differences in the shapes of reproductive
Q95: Suppose a hybrid zone exists between two
Q96: Polyploidy can arise from the combining of
Q98: Species of lacewings apparently evolved reproductive isolation
Q99: The proliferation of a large number of
Q101: The yellow-rumped warbler was formerly split into
Q102: In autopolyploidy, a new species of plant
Q103: Which of the following is not a
Q117: Speciation rates in plants are _ in
Q120: Except in cases of polyploidy, sympatric speciation
Unlock this Answer For Free Now!
View this answer and more for free by performing one of the following actions

Scan the QR code to install the App and get 2 free unlocks

Unlock quizzes for free by uploading documents