Consider the following set of quarterly sales data,given in thousands of dollars. 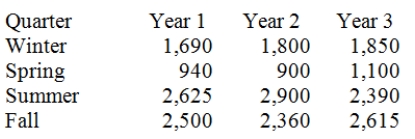 The following dummy variable model that incorporates a linear trend and constant seasonal variation was used: y(t)= B0 + B1t + BQ1(Q1)+ BQ2(Q2)+ BQ3(Q3)+ Et.In this model,there are 3 binary seasonal variables (Q1,Q2,and Q3),where Qi is a binary (0,1)variable defined as:
Qi = 1,if the time series data is associated with quarter i;
Qi = 0,if the time series data is not associated with quarter i.The results associated with this data and model are given in the following Minitab computer output.The regression equation is
Sales = 2442 + 6.2Time − 693Q1 − 1499Q2 + 153Q3 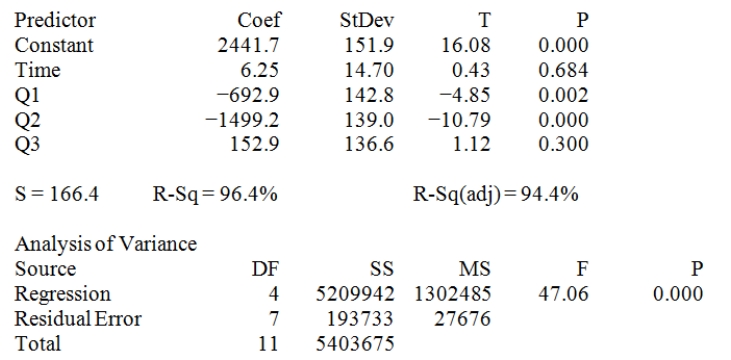 Provide a managerial interpretation of the regression coefficients for the variables Q1 (quarter 1),Q2 (quarter 2),and Q3 (quarter 3).
Correct Answer:
Verified
View Answer
Unlock this answer now
Get Access to more Verified Answers free of charge
Q109: Consider the quarterly production data (in thousands
Q110: The linear trend equation for the following
Q111: Two forecasting models were used to predict
Q112: Consider the regression equation Q113: Using the price of the following food Q114: Two forecasting models were used to predict Q115: Consider the following data and calculations.Calculate the Q117: Consider a time series with 15 quarterly Q118: Consider a time series with 15 quarterly Q119: The following data on prices and quantities![]()
Unlock this Answer For Free Now!
View this answer and more for free by performing one of the following actions

Scan the QR code to install the App and get 2 free unlocks

Unlock quizzes for free by uploading documents