The following is a relative frequency distribution of grades in an introductory statistics course. 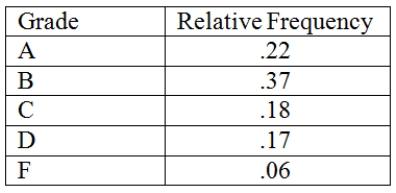 If we wish to depict these data using a pie chart,find how many degrees (out of 360 degrees)should be assigned to each grade.
Correct Answer:
Verified
Q65: Consider the following data on distances traveled
Q66: Fill in the missing components of the
Q67: The number of weekly sales calls by
Q68: A local electronics retailer recently conducted a
Q69: The percentage of measurements in a class
Q71: The following is a relative frequency distribution
Q72: The following is a relative frequency distribution
Q73: A very simple graph that can be
Q74: A relative frequency curve having a long
Q75: Consider the following data. ![]()
Unlock this Answer For Free Now!
View this answer and more for free by performing one of the following actions

Scan the QR code to install the App and get 2 free unlocks

Unlock quizzes for free by uploading documents