Exhibit 6-3
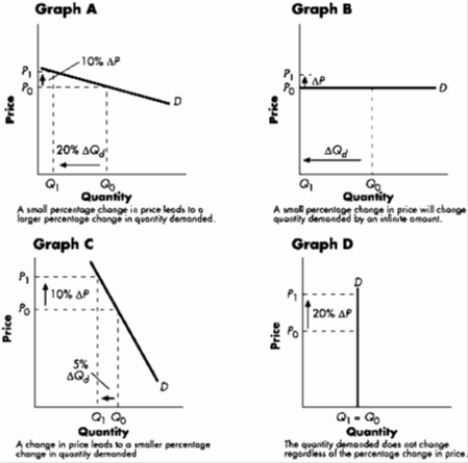
-Refer to Exhibit 6-3. The graph that best illustrates a relatively inelastic (but not perfectly inelastic) range along a demand curve is:
A) Graph A.
B) Graph B.
C) Graph C.
D) Graph D.
Correct Answer:
Verified
Q84: Which of the following is not a
Q85: The price of a new electronic toy
Q86: A price cut will decrease the total
Q87: What type of demand curve is depicted
Q88: A bountiful wheat harvest can be bad
Q90: When demand and income move in the
Q91: A price cut will increase the total
Q92: The price of a new toy increases
Q93: When a product's price increases from $800
Q94: When a product's price increases from $9
Unlock this Answer For Free Now!
View this answer and more for free by performing one of the following actions

Scan the QR code to install the App and get 2 free unlocks

Unlock quizzes for free by uploading documents