Multiple Choice
Exhibit 6-4 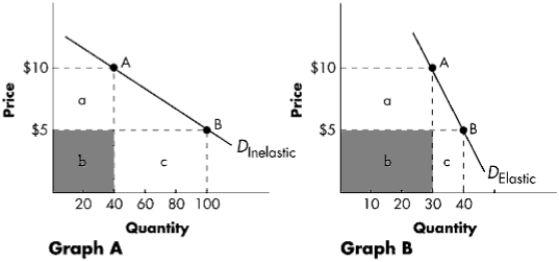
-Refer to Exhibit 6-4. Graph B represents a demand curve that is relatively ____in the range illustrated. Total revenue ____ as the price decreases from $10 to $5.
A) inelastic; decreases
B) elastic; decreases
C) elastic; increases
D) inelastic; increases
Correct Answer:
Verified
Related Questions
Q111: A jeweler cut prices in his store
Q112: Exhibit 6-4 Q113: Which of the following is associated with Q114: If the demand curve for a product Q115: When the price of ulcer medication increased![]()
Unlock this Answer For Free Now!
View this answer and more for free by performing one of the following actions

Scan the QR code to install the App and get 2 free unlocks

Unlock quizzes for free by uploading documents