Exhibit 5-2
The diagram below represents the market for butter. 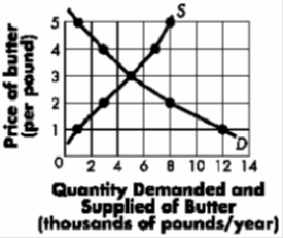
-Refer to Exhibit 5-2. If a price ceiling of $4 is imposed, we would expect that ____ units of butter will be purchased.
A) 7,000
B) 5,000
C) 4,000
D) 3,000
Correct Answer:
Verified
Q72: A safety report is released that contends
Q73: Exhibit 5-4 Q74: Which of the following would most likely Q75: Exhibit 5-4 Q76: In 1975 a pocket calculator cost more Q78: Exhibit 5-2 Q79: Exhibit 5-2 Q80: Exhibit 5-2 Q81: If the price of peanut butter decreases Q82: Pork from pigs can be used to
![]()
![]()
The diagram below represents the market
The diagram below represents the market
The diagram below represents the market
Unlock this Answer For Free Now!
View this answer and more for free by performing one of the following actions

Scan the QR code to install the App and get 2 free unlocks

Unlock quizzes for free by uploading documents