The graph below depicts a(n) : 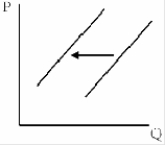
A) supply increase.
B) supply decrease.
C) decrease in demand.
D) increase in demand.
Correct Answer:
Verified
Q90: If the price of ice cream increases
Q91: The invention of machinery that can double
Q92: Ceteris paribus, if the price of jet
Q93: A shift in the supply curve of
Q94: Cold weather in the Midwestern and eastern
Q96: Which of the following is an example
Q97: In January, 2,500 quarts of ice cream
Q98: Pork from pigs can be used to
Q99: A simultaneous increase in demand and decrease
Q100: A more efficient process for refining oil
Unlock this Answer For Free Now!
View this answer and more for free by performing one of the following actions

Scan the QR code to install the App and get 2 free unlocks

Unlock quizzes for free by uploading documents