Exhibit 18.3.The following table shows the annual revenues (in millions of dollars) of a pharmaceutical company over the period 1990-2011. 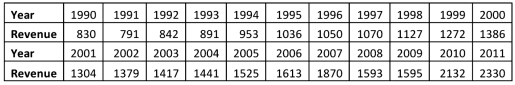
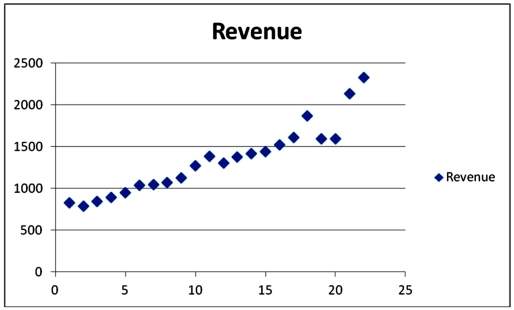 Excel scatterplot shown above indicates that the annual revenues have an increasing trend.Therefore,linear,exponential,quadratic and cubic models were used to fit the trend,and the following relevant information became available after applying linear regression.
 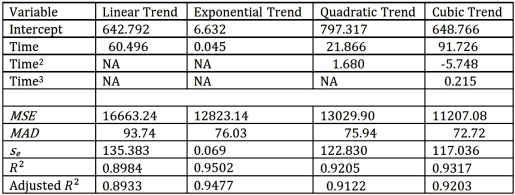 Refer to Exhibit 18.3.Using the linear trend equation,one can say that the predicted revenue increases by
A) 642,792,000 a year.
B) $604,930,000 a year.
C) $60,493,000 a year.
D) $6,049,300 a year.
Correct Answer:
Verified
Q34: All criteria used for selecting the best
Q38: In which of the following situations is
Q42: Exhibit 18.3.The following table shows the annual
Q43: In the quadratic trend model, 
Q46: Exhibit 18.2.The following table includes the information
Q47: Exhibit 18.3.The following table shows the annual
Q48: Exhibit 18.2.The following table includes the information
Q49: In comparison with the linear trend model,which
Q65: Which of the following types of trend
Q67: The _ is a trend model that
Unlock this Answer For Free Now!
View this answer and more for free by performing one of the following actions

Scan the QR code to install the App and get 2 free unlocks

Unlock quizzes for free by uploading documents