Exhibit 18.3.The following table shows the annual revenues (in millions of dollars) of a pharmaceutical company over the period 1990-2011. 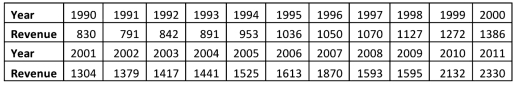
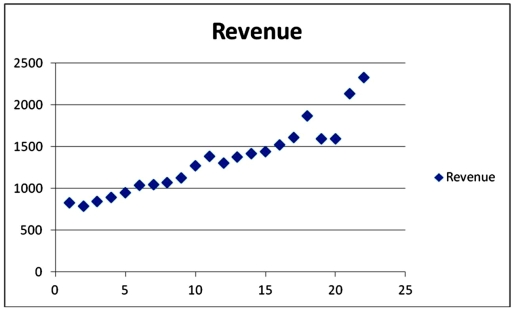 Excel scatterplot shown above indicates that the annual revenues have an increasing trend.Therefore,linear,exponential,quadratic and cubic models were used to fit the trend,and the following relevant information became available after applying linear regression.
 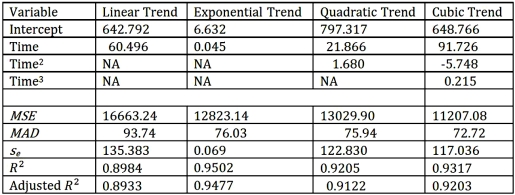 Refer to Exhibit 18.3.What is an exponential trend equation?
A) 
B) 
C) 
D) 
Correct Answer:
Verified
Q49: Which of the following is true of
Q51: Exhibit 18.3.The following table shows the annual
Q53: Which of the following formulas is used
Q54: Exhibit 18.2.The following table includes the information
Q56: Which of the following types of trend
Q57: When comparing which of the following trend
Q58: Exhibit 18.2.The following table includes the information
Q59: Exhibit 18.3.The following table shows the annual
Q60: Exhibit 18.2.The following table includes the information
Q62: A polynomial trend model that only allows
Unlock this Answer For Free Now!
View this answer and more for free by performing one of the following actions

Scan the QR code to install the App and get 2 free unlocks

Unlock quizzes for free by uploading documents