Exhibit 18.7.The following table shows the annual revenues (in millions of dollars)of a pharmaceutical company over the period 1990-2011. 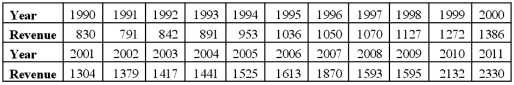 The autoregressive models of order 1 and 2,
 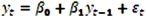 and
and  ,were applied on the time series to make revenue forecasts.The relevant parts of Excel regression outputs are given below.
Model AR(1): 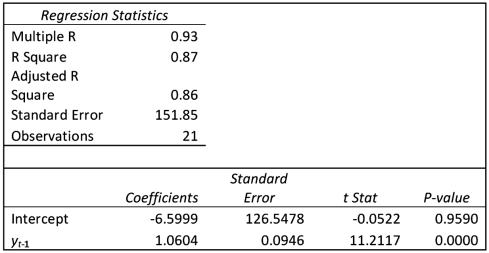 Model AR(2):
 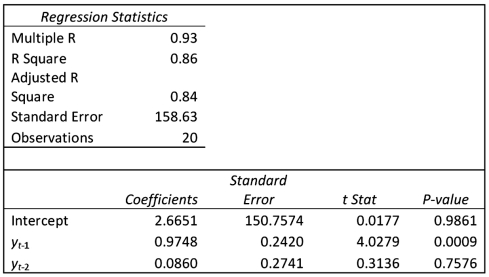 Refer to Exhibit 18.7.(Use Regression in Data Analysis of Excel. )Compare the autoregressive models,
  and
and  ,through the use of MSE and MAD.Hint.You may compute the errors by clicking "Residuals";to analyze
  instead of
  ,it suffices to click "Constant is Zero".
Correct Answer:
Verified
View Answer
Unlock this answer now
Get Access to more Verified Answers free of charge
Q83: Exhibit 18.6.Based on quarterly data collected over
Q84: The model Q85: Exhibit 18.5.Based on quarterly data collected over Q86: Exhibit 18.8.Quarterly sales of a department store Q87: If T denotes the number of observations,which Q89: Exhibit 18.8.Quarterly sales of a department store Q90: Exhibit 18.7.The following table shows the annual Q91: Exhibit 18.6.Based on quarterly data collected over Q92: Given the estimated model Q93: Exhibit 18.7.The following table shows the annual![]()
![]()
Unlock this Answer For Free Now!
View this answer and more for free by performing one of the following actions

Scan the QR code to install the App and get 2 free unlocks

Unlock quizzes for free by uploading documents