Exhibit 16.2.Typically,the sales volume declines with an increase of a product price.It has been observed,however,that for some luxury goods the sales volume may increase when the price increases.The following Excel output illustrates this rather unusual relationship. 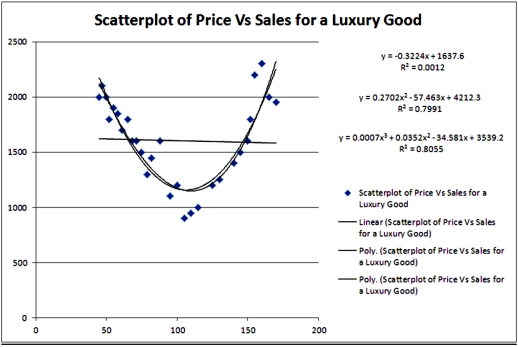 Refer to Exhibit 16.2.For the considered range of the price,the relationship between Price and Sales should be described by a:
A) concave function.
B) hyperbola.
C) convex function.
D) linear function.
Correct Answer:
Verified
Q7: The regression model ln(y)= β0 + β1
Q12: The equation y = β0 + β1x
Q17: For the model ln(y)= β0 + β1ln(x)+
Q21: Exhibit 16-1.The following Excel scatterplot with the
Q22: What is the effect of b2 <
Q24: Exhibit 16-1.The following Excel scatterplot with the
Q25: For the quadratic regression equation 
Q26: An inverted U-shaped curve is also known
Q27: Exhibit 16-1.The following Excel scatterplot with the
Q28: Exhibit 16-1.The following Excel scatterplot with the
Unlock this Answer For Free Now!
View this answer and more for free by performing one of the following actions

Scan the QR code to install the App and get 2 free unlocks

Unlock quizzes for free by uploading documents