Exhibit 16.5.The following data shows the demand for an airline ticket dependent on the price of this ticket. 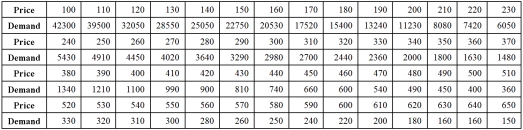 For the assumed cubic and log-log regression models,Demand = β0 + β1Price + β2Price2 + β3Price3 + ε and ln(Demand) = β0 + β1ln(Price) + ε,the following regression results are available:
 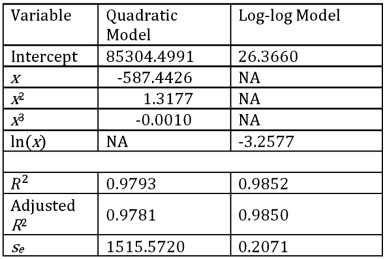 Refer to Exhibit 16.5.What does the slope of the obtained regression equation
  signify?
A) For every 1% increase in the price,the predicted demand declines by approximately 3.2577%.
B) For every 1% increase in the demand,the expected price increases by approximately 3.2577%.
C) For every 1% increase in the demand,the expected price decreases by approximately 3.2577%.
D) For every 1% increase in the price,the predicted demand increases by approximately 3.2577%.
Correct Answer:
Verified
Q67: Exhibit 16.5.The following data shows the demand
Q68: Exhibit 16-4.The following data shows the cooling
Q69: Exhibit 16.6.Thirty employed single individuals were randomly
Q70: Exhibit 16.5.The following data shows the demand
Q71: Exhibit 16.6.Thirty employed single individuals were randomly
Q73: Exhibit 16.5.The following data shows the demand
Q74: Exhibit 16.6.Thirty employed single individuals were randomly
Q75: Exhibit 16.5.The following data shows the demand
Q76: Exhibit 16.6.Thirty employed single individuals were randomly
Q77: Exhibit 16.5.The following data shows the demand
Unlock this Answer For Free Now!
View this answer and more for free by performing one of the following actions

Scan the QR code to install the App and get 2 free unlocks

Unlock quizzes for free by uploading documents