Exhibit 16.6.Thirty employed single individuals were randomly selected to examine the relationship between their age (Age)and their credit card debt (Debt)expressed as a percentage of their annual income.Three polynomial models were applied and the following table summarizes Excel's regression results. 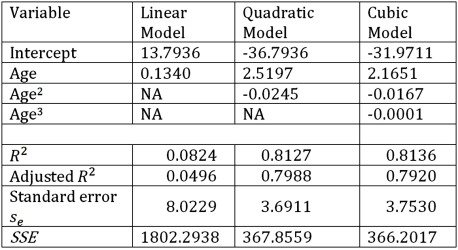 Refer to Exhibit 16.6.What is the percentage of variations in Debt explained by Age in the regression equation with the best fit?
Correct Answer:
Verified
Q73: Exhibit 16.5.The following data shows the demand
Q74: Exhibit 16.6.Thirty employed single individuals were randomly
Q75: Exhibit 16.5.The following data shows the demand
Q76: Exhibit 16.6.Thirty employed single individuals were randomly
Q77: Exhibit 16.5.The following data shows the demand
Q79: Exhibit 16-4.The following data shows the cooling
Q80: Exhibit 16.6.Thirty employed single individuals were randomly
Q81: Exhibit 16-7.It is believed that the sales
Q82: Exhibit 16.6.Thirty employed single individuals were randomly
Q83: Exhibit 16-7.It is believed that the sales
Unlock this Answer For Free Now!
View this answer and more for free by performing one of the following actions

Scan the QR code to install the App and get 2 free unlocks

Unlock quizzes for free by uploading documents