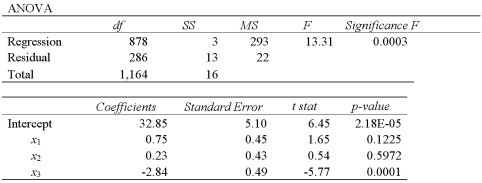
The accompanying table shows the regression results when estimating  .
.  a.Specify the competing hypotheses to determine whether the explanatory variables are jointly significant.
B)At the 5% significance level,are the explanatory variables jointly significant? Explain.
C)At the 5% significance level,is x2 significant in explaining y? Explain.
D)At the 5% significance level,is the slope coefficient attached to x3 different from -2?
Correct Answer:
Verified
View Answer
Unlock this answer now
Get Access to more Verified Answers free of charge
Q96: Exhibit 15-8.A real estate analyst believes that
Q97: Exhibit 15-6.Tiffany & Co.has been the world's
Q98: Exhibit 15-9.An economist estimates the following model:
Q99: Exhibit 15-8.A real estate analyst believes that
Q100: Exhibit 15-8.A real estate analyst believes that
Q102: In a multiple regression based on 30
Q103: Assume you ran a multiple regression to
Q104: An analyst examines the effect that various
Q105: A simple linear regression, Q106: In a simple linear regression based on![]()
Unlock this Answer For Free Now!
View this answer and more for free by performing one of the following actions

Scan the QR code to install the App and get 2 free unlocks

Unlock quizzes for free by uploading documents