Exhibit 14-6.A manager at a local bank analyzed the relationship between monthly salary (y,in $) and length of service (x,measured in months) for 30 employees.She estimates 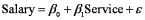 .The following table summarizes a portion of the regression results:
  Refer to Exhibit 14-6.The coefficient of determination indicates that
A) 18.39% of the variation in Salary is explained by the variation in Service.
B) 18.39% of the variation in Service is explained by the variation in Salary.
C) 81.61% of the variation in Salary is explained by the variation in Service.
D) 81.61% of the variation in Service is explained by the variation in Salary.
Correct Answer:
Verified
Q76: Exhibit 14-1.Over the past 30 years,the sample
Q77: Exhibit 14-5.An marketing analyst wants to examine
Q78: Exhibit 14-4.Consider the following sample regression equation
Q79: Exhibit 14-5.An marketing analyst wants to examine
Q80: Exhibit 14-3.Consider the following sample regression equation
Q82: Exhibit 14-7.Assume you ran a multiple regression
Q83: Exhibit 14-10.A sociologist examines the relationship between
Q84: A statistics instructor wants to examine the
Q85: Exhibit 14-6.A manager at a local bank
Q86: Exhibit 14-8.An real estate analyst believes that
Unlock this Answer For Free Now!
View this answer and more for free by performing one of the following actions

Scan the QR code to install the App and get 2 free unlocks

Unlock quizzes for free by uploading documents