Exhibit 14-10.A sociologist examines the relationship between the poverty rate and several socioeconomic factors.For the 50 states and the District of Columbia (n = 51) ,he collects data on the poverty rate (y,in %) ,the percent of the population with at least a high school education (x1) ,median income (x2,in $1000s) ,and the mortality rate per 1,000 residents (x3) .He estimates the following model:  .The following table shows a portion of the regression results.
 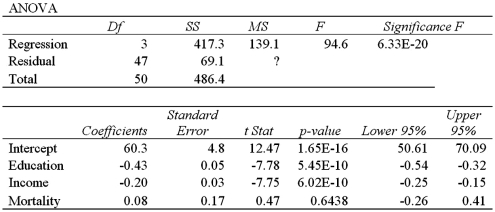 Notes: Data obtained from the Statistical Abstract of the US for the year 2007. Refer to Exhibit 14-10.The coefficient of determination indicates that
A) 14% of the variation in the poverty rate is explained by the regression model.
B) 14% of the variation in the regression model is explained by the variation in the poverty rate.
C) 86% of the variation in the poverty rate is explained by the regression model.
D) 86% of the variation in the regression model is explained by the variation in the poverty rate.
Correct Answer:
Verified
Q92: A sample of 30 observations provides the
Q93: Exhibit 14-7.Assume you ran a multiple regression
Q94: Exhibit 14-9.When estimating Q95: Exhibit 14-6.A manager at a local bank Q96: Consider the following sample data: Q98: Exhibit 14-8.An real estate analyst believes that Q99: Exhibit 14-9.When estimating Q100: Exhibit 14-9.When estimating Q101: The following ANOVA table was obtained when Q102: A researcher analyzes the relationship between amusement Unlock this Answer For Free Now! View this answer and more for free by performing one of the following actions Scan the QR code to install the App and get 2 free unlocks Unlock quizzes for free by uploading documents![]()

![]()
![]()

