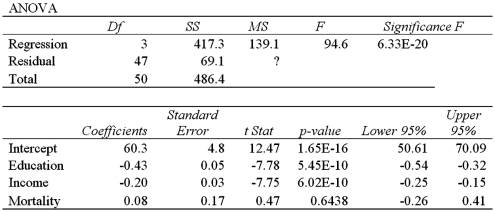
Exhibit 14-10.A sociologist examines the relationship between the poverty rate and several socioeconomic factors.For the 50 states and the District of Columbia (n = 51) ,he collects data on the poverty rate (y,in %) ,the percent of the population with at least a high school education (x1) ,median income (x2,in $1000s) ,and the mortality rate per 1,000 residents (x3) .He estimates the following model:  .The following table shows a portion of the regression results.
  Notes: Data obtained from the Statistical Abstract of the US for the year 2007. Refer to Exhibit 14-10.What is the mean square error,MSE?
A) 0
B) 1.5
C) 3.0
D) 4.5
Correct Answer:
Verified
Q84: A statistics instructor wants to examine the
Q85: Exhibit 14-6.A manager at a local bank
Q86: Exhibit 14-8.An real estate analyst believes that
Q87: Exhibit 14-9.When estimating Q88: Exhibit 14-8.An real estate analyst believes that Q90: Exhibit 14-8.An real estate analyst believes that Q91: Exhibit 14-7.Assume you ran a multiple regression Q92: A sample of 30 observations provides the Q93: Exhibit 14-7.Assume you ran a multiple regression Q94: Exhibit 14-9.When estimating ![]()
![]()
Unlock this Answer For Free Now!
View this answer and more for free by performing one of the following actions

Scan the QR code to install the App and get 2 free unlocks

Unlock quizzes for free by uploading documents