Exhibit 13.4 The ANOVA test performed for Exhibit 13.2 determined that not all mean commute times across the four cities are equal.However,it did not indicate which means differed.To find out which population means differ requires further analysis of the direction and the statistical significance of the difference between paired population means.Tukey 95% confidence intervals are shown below. 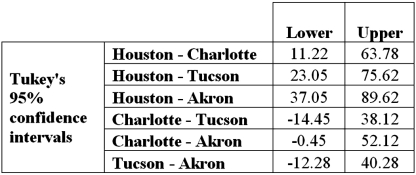 Refer to Exhibit 13.4.The conclusion of the Tukey confidence intervals is:
A) The mean commute time in Houston is different from the mean commute time in Charlotte,Tucson,and Akron.
B) The mean commute time in Charlotte is different from the mean commute time in Houston,Tucson,and Akron.
C) The mean commute time in Tucson is different from the mean commute time in Houston,Charlotte,and Akron.
D) The mean commute time in Akron is different from the mean time in Houston,Charlotte,and Tucson.
Correct Answer:
Verified
Q54: Exhibit 13.6 A researcher wants to understand
Q55: Exhibit 13.4 The ANOVA test performed for
Q56: Exhibit 13.5 A police chief wants to
Q57: Exhibit 13.4 The ANOVA test performed for
Q58: Exhibit 13.6 A researcher wants to understand
Q60: Exhibit 13.6 A researcher wants to understand
Q61: Exhibit 13.8 A market researcher is studying
Q62: Exhibit 13.7 A market researcher is studying
Q63: Exhibit 13.8 A market researcher is studying
Q64: A farmer plants tomato seeds into four
Unlock this Answer For Free Now!
View this answer and more for free by performing one of the following actions

Scan the QR code to install the App and get 2 free unlocks

Unlock quizzes for free by uploading documents