Exhibit 12.5 In the following table,individuals are cross-classified by their age group and income level. 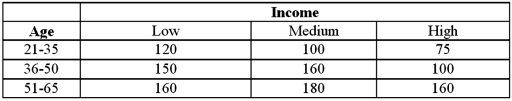 Refer to Exhibit 12.5.Which of the following is the expected joint probability for the 'low income and 21-35 age group' cell assuming age group and income are independent?
A) 0.0830
B) 0.0874
C) 0.0996
D) 0.1328
Correct Answer:
Verified
Q42: Exhibit 12.3 A fund manager wants to
Q43: Exhibit 12.4 In the following table,likely voters'
Q44: Exhibit 12.3 A fund manager wants to
Q45: Exhibit 12.4 In the following table,likely voters'
Q46: Exhibit 12.4 In the following table,likely voters'
Q48: Exhibit 12.4 In the following table,likely voters'
Q49: Exhibit 12.4 In the following table,likely voters'
Q50: Exhibit 12.2 A university has six colleges
Q51: Exhibit 12.5 In the following table,individuals are
Q52: Exhibit 12.3 A fund manager wants to
Unlock this Answer For Free Now!
View this answer and more for free by performing one of the following actions

Scan the QR code to install the App and get 2 free unlocks

Unlock quizzes for free by uploading documents