Exhibit 12.7 The heights (in cm) for a random sample of 60 males were measured.The sample mean is 166.55,the standard deviation is 12.57,the sample kurtosis is 0.12,and the sample skewness is -0.23.The following table shows the heights subdivided into non-overlapping intervals. 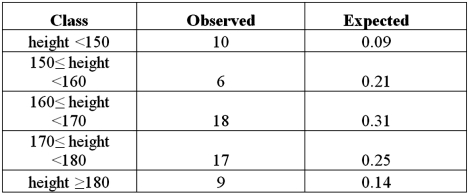 Refer to Exhibit 12.7.Using the p-value approach and
  ,the decision and conclusion are:
A) Reject the null hypothesis,conclude heights have a normal distribution
B) Reject the null hypothesis,conclude heights do not have a normal distribution
C) Do not reject the null hypothesis,conclude heights have a normal distribution
D) Do not reject the null hypothesis,conclude heights do not have a normal distribution
Correct Answer:
Verified
Q90: The following table shows numerical summaries of
Q91: The following table shows numerical summaries of
Q92: The following table shows the observed frequencies
Q93: The following table shows the cross-classification of
Q94: Exhibit 12.8 The heights (in cm)for a
Q95: Exhibit 12.8 The heights (in cm)for a
Q97: Exhibit 12.7 The heights (in cm)for a
Q98: The following table shows the cross-classification of
Q100: Exhibit 12.7 The heights (in cm)for a
Q115: MARS claims that Skittles candies should be
Unlock this Answer For Free Now!
View this answer and more for free by performing one of the following actions

Scan the QR code to install the App and get 2 free unlocks

Unlock quizzes for free by uploading documents