The following table shows the heights (in inches)of individuals recorded recently for two families,the Williams' and the Thomas',in Chicago,Illinois: 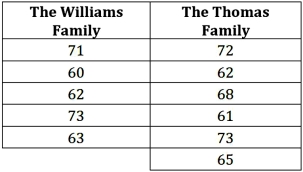 a.Construct a 95% interval estimate of the ratio of the population variances.
B)Using the computed confidence interval,test if the ratio of the population variances differs from one at the 5% significance level.Explain.
Correct Answer:
Verified
b.Rat...
View Answer
Unlock this answer now
Get Access to more Verified Answers free of charge
Q79: The following data,drawn from a normal population,is
Q80: Consider the following hypotheses: Q81: The following are the measures based on Q83: The sales price (in $1,000)of three-bedroom apartments Q85: Use the F table to approximate the Q86: Construct a 95% interval estimate of the Q87: Consider the following competing hypotheses and relevant Q88: Two students,Mary and Joanna,in a Statistics class Q89: Find the value x for which: Q104: The administrator of a college is concerned![]()
A)
Unlock this Answer For Free Now!
View this answer and more for free by performing one of the following actions

Scan the QR code to install the App and get 2 free unlocks

Unlock quizzes for free by uploading documents