The following table shows the annual returns (in percent)for Fidelity's Technology and Communications funds for the years 2006 through 2010. 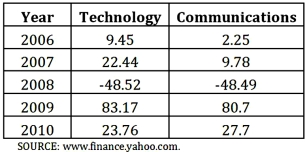 Use the critical value approach to test if the population variances differ at the 10% significance level.State the assumptions.
Correct Answer:
Verified
View Answer
Unlock this answer now
Get Access to more Verified Answers free of charge
Q86: Construct a 95% interval estimate of the
Q87: Consider the following competing hypotheses and relevant
Q88: Two students,Mary and Joanna,in a Statistics class
Q89: Find the value x for which:
A)
Q90: Use the p-value approach to conduct the
Q91: A researcher analyzes the returns for two
Q92: To estimate the ratio of the population
Q93: (Use Excel)The following are the prices (in
Q95: Using the critical value approach,conduct the following
Q96: A supermarket has just added a new
Unlock this Answer For Free Now!
View this answer and more for free by performing one of the following actions

Scan the QR code to install the App and get 2 free unlocks

Unlock quizzes for free by uploading documents