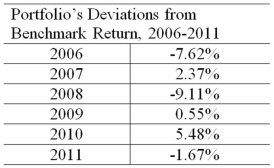
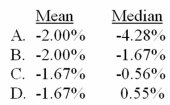
The table below gives the deviations of a portfolio's annual total returns from its benchmark's annual returns,for a 6-year period ending in 2011.  The arithmetic mean return and median return are closest to:
A) Option A
B) Option B
C) Option C
D) Option D
Correct Answer:
Verified
Q21: Is it possible for a data set
Q23: Consider the following data: 1,2,4,5,10,12,18.The 30th percentile
Q24: As of September 30,2011,the earnings per share,EPS,of
Q25: The owner of a company has recently
Q26: Which of the following statements about variance
Q26: Which five values are graphed on a
Q31: In what way(s)is the concept of geometric
Q32: The following data represent monthly returns (in
Q33: Sales for Adidas grew at a rate
Q34: Calculate the interquartile range from the following
Unlock this Answer For Free Now!
View this answer and more for free by performing one of the following actions

Scan the QR code to install the App and get 2 free unlocks

Unlock quizzes for free by uploading documents