The following frequency distribution represents the number of hours studied per week by a sample of 50 students. 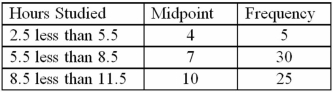 The mean number of hours studied is:
A) 7 hours
B) 8 hours
C) 22.8 hours
D) 480 hours
Correct Answer:
Verified
Q80: As of September 30,2011,the earnings per share,EPS,of
Q82: Automobiles traveling on a road with a
Q84: Amounts spent by a sample of 200
Q86: Which of the following relationships may be
Q87: Amounts spent by a sample of 50
Q88: Amounts spent by a sample of 50
Q89: The following frequency distribution represents the number
Q90: Professors at a local university earn an
Q112: The covariance between the returns on two
Q131: Calculate the mean,median,and mode of the sample
Unlock this Answer For Free Now!
View this answer and more for free by performing one of the following actions

Scan the QR code to install the App and get 2 free unlocks

Unlock quizzes for free by uploading documents