Exhibit 2-3.A city in California spent six million dollars repairing damage to its public buildings in 2010.The following table shows the categories where the money was directed. 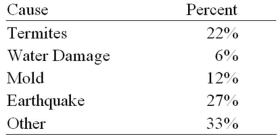 Refer to Exhibit 2-3.How much did the city spend to fix damage caused by mold?
A) $360,000
B) $720,000
C) $1,440,000
D) $1,800,000
Correct Answer:
Verified
Q26: Exhibit 2-4.Students in Professor Smith's Business Statistics
Q27: The accompanying chart shows the number of
Q27: Which of the following best describes a
Q28: Exhibit 2-2.The following is a list of
Q29: Exhibit 2-5.The following data represent scores on
Q30: Exhibit 2-2.The following is a list of
Q32: The accompanying chart shows the numbers of
Q33: Exhibit 2-5.The following data represent scores on
Q34: In the following pie chart representing a
Q35: Exhibit 2-3.A city in California spent six
Unlock this Answer For Free Now!
View this answer and more for free by performing one of the following actions

Scan the QR code to install the App and get 2 free unlocks

Unlock quizzes for free by uploading documents