Exhibit 2-6.The following data represent the recent sales price (in $1,000s) of 24 homes in a Midwestern city. 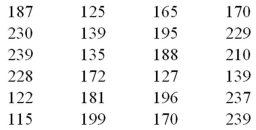 Refer to Exhibit 2-6.Suppose the data on house prices will be grouped into five classes.The width of the classes for a frequency distribution or histogram is closest to ______.
A) 15
B) 20
C) 25
D) 30
Correct Answer:
Verified
Q15: An ogive is a graph that plots
Q16: A frequency distribution for qualitative data groups
Q18: A histogram is a series of rectangles
Q18: The relative frequency of a category is
Q18: In order to summarize qualitative data,a useful
Q23: Exhibit 2-5.The following data represent scores on
Q24: Exhibit 2-6.The following data represent the recent
Q25: When constructing a frequency distribution for quantitative
Q26: Exhibit 2-4.Students in Professor Smith's Business Statistics
Q40: What graphical tool is best used to
Unlock this Answer For Free Now!
View this answer and more for free by performing one of the following actions

Scan the QR code to install the App and get 2 free unlocks

Unlock quizzes for free by uploading documents