Multiple Choice
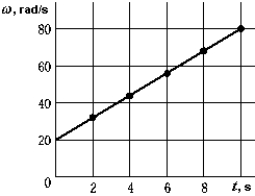 The data used to construct the graph were taken from the tachometer of an airplane. The angular acceleration during the 10 s interval was
A) 3.0 rad/s2
B) 6.0 rad/s2
C) 8.0 rad/s2
D) 20 rad/s2
E) 38 rad/s2
Correct Answer:
Verified
Related Questions
Q21: Which of the following statements about the
Q22: A 2.0-kg mass is attached to the
Q22: A penny is placed 0.10 m from
Unlock this Answer For Free Now!
View this answer and more for free by performing one of the following actions

Scan the QR code to install the App and get 2 free unlocks

Unlock quizzes for free by uploading documents