Multiple Choice
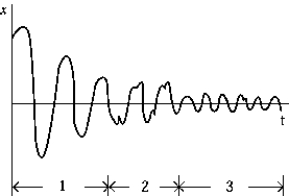 The graph shows the response of a driven oscillatory system as a function of time. The region(s) of the graph that show(s) the steady-state response is(are)
A) 1
B) 2
C) 3
D) 1 and 2
E) 2 and 3
Correct Answer:
Verified
Related Questions
Q103: Use the following to answer question:
Q115: Use the following to answer question:
Q116: Use the following to answer question:
Q119: Use the following to answer question:
Q122: Use the figure to the right to
Q123: The width of a resonance curve is
Q124: The shattering of a crystal glass by
Unlock this Answer For Free Now!
View this answer and more for free by performing one of the following actions

Scan the QR code to install the App and get 2 free unlocks

Unlock quizzes for free by uploading documents