Multiple Choice
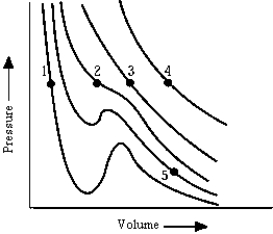 The graph shows isotherms of a gas plotted from van der Waal's equation. At which point is a mixture of liquid and vapor likely to be found?
A) 1
B) 2
C) 3
D) 4
E) 5
Correct Answer:
Verified
Related Questions
Q25: The triple point of a substance gas
Q26: If the thickness of a uniform wall
Q28: A scuba tank of volume 40 L
Q30: During the evening the partial pressure of
Q33: A certain blackbody radiates 100 W at
Q41: The main process by which heat is
Unlock this Answer For Free Now!
View this answer and more for free by performing one of the following actions

Scan the QR code to install the App and get 2 free unlocks

Unlock quizzes for free by uploading documents