The table shows the price of motor fuel (mainly gasoline)and the overall price level (the consumer price index)in five-year intervals over the period 1970 through 1990. 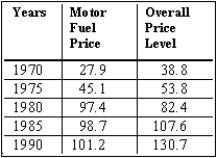 (A)Plot a diagram of the relative price of motor fuel for the 1970-1990 period.
(B)Explain what has been happening to the relative price of motor fuel over this period.
Correct Answer:
Verified
View Answer
Unlock this answer now
Get Access to more Verified Answers free of charge
Q13: It has been documented that beer consumption
Q15: If we observe that an increase in
Q17: Which of the following is not an
Q19: All of the following are examples of
Q20: An economic variable is any economic measure
Q22: Economics has always been a good example
Q25: A model gives the most realistic description
Q33: Macroeconomics deals with large industries such as
Q35: An economic model is the same as
Q36: Economic models need to resemble, as much
Unlock this Answer For Free Now!
View this answer and more for free by performing one of the following actions

Scan the QR code to install the App and get 2 free unlocks

Unlock quizzes for free by uploading documents