Exhibit 17-5 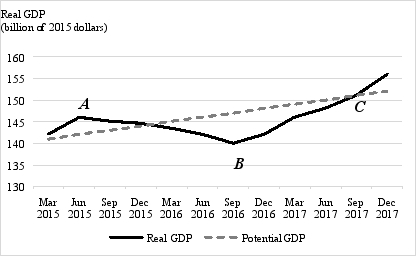
-Exhibit 17-5 shows real GDP from March 2010 through September 2012 for a certain country. Of points A, B, and C, indicate where the rate of inflation is rising, staying constant, and declining.
Correct Answer:
Verified
View Answer
Unlock this answer now
Get Access to more Verified Answers free of charge
Q148: Suppose, when you retire 40 years from
Q149: Suppose real GDP per capita grows at
Q150: Describe the behavior of real GDP, the
Q151: Suppose the CPI in 2015 was 188.9.
Q152: The following table gives some recent data
Q154: Suppose the U.S. economy is currently recovering
Q155: Suppose you have $1,000, which you can
Q156: Suppose you have savings deposited in an
Q157: Suppose you deposit $100 in the bank
Q158: Why would it be a good idea
Unlock this Answer For Free Now!
View this answer and more for free by performing one of the following actions

Scan the QR code to install the App and get 2 free unlocks

Unlock quizzes for free by uploading documents