The shaded block in the table below shows the amount of output that can be produced using different combinations of labor and capital in a hypothetical economy with a given type of technology.For example,1,200 units of output are produced when 75 units of labor and 75 units of capital are combined.This table is an example of a production function. 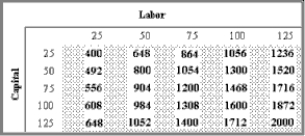 (A)Hold capital constant at 50 while you increase labor.What happens to output?
(B)Now hold labor constant at 50 and raise the level of capital.What happens to output?
(C)Finally,what happens to output when labor and capital are raised by the same amount,assuming that you start with 50 units of each?
(D)Sketch the production function on a graph that plots labor on the horizontal axis and output on the vertical axis.Assume capital is fixed at 50.What happens to the graph if capital is increased to 100?
(E)What happens to the output numbers in the table if there is an improvement in technology? What would happen to your graph in part (D)?
Correct Answer:
Verified
View Answer
Unlock this answer now
Get Access to more Verified Answers free of charge
Q124: According to the theory of economic fluctuations,
Q138: Aggregate demand can be greater than potential
Q138: The primary tools that the Federal Reserve
Q144: Suppose you have savings deposited in an
Q144: Suppose there is a permanent decrease in
Q147: Is it a good idea for the
Q148: Describe the behavior of real GDP,the unemployment
Unlock this Answer For Free Now!
View this answer and more for free by performing one of the following actions

Scan the QR code to install the App and get 2 free unlocks

Unlock quizzes for free by uploading documents