The following table shows the relationship between income and consumption in an economy. 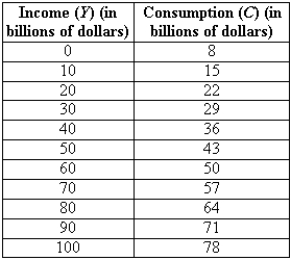
Assume that investment (I)is $5 billion,government purchases (G)are $4 billion,and net exports (X)are $1 billion.
(A)What is the numerical value of the marginal propensity to consume?
(B)Construct a table that is analogous to the one presented in the text for this economy.What is the level of income at the point of spending balance?
(C)For this level of income,calculate national saving.Is national saving equal to investment plus net exports?
(D)Suppose the above problem is modified to include taxes.Suppose first that,at any level of income,consumers must pay taxes equal to $3 billion.Find the new level of spending balance by modifying the table.Hint: If consumers have to pay taxes,this is income that they cannot use for consumption.Verify again that national saving is equal to investment plus net exports.Find private and government saving.
(E)Graphically illustrate what happens to spending balance when the government increases taxes by $3 million.
Correct Answer:
Verified
View Answer
Unlock this answer now
Get Access to more Verified Answers free of charge
Q122: According to the spending balance model, a
Q128: If spending is greater than output, a
Q132: If spending as given by the expenditure
Q137: When does the slope of the expenditure
Q139: When spending is equal to output and
Q140: Suppose the consumption function equaled C =
Q144: Which of the following is true?
A)Potential GDP
Q146: Describe what happens to the aggregate expenditure
Q146: Sketch the 45-degree line and the expenditure
Q147: Suppose that the expenditure line initially intersects
Unlock this Answer For Free Now!
View this answer and more for free by performing one of the following actions

Scan the QR code to install the App and get 2 free unlocks

Unlock quizzes for free by uploading documents