Using the information in the table below,draw a production possibilities curve. 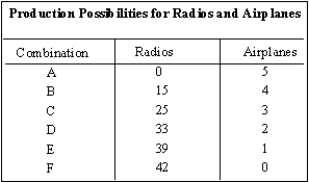
(A)With this graph,depict the point that would show the combination of 30 radios and 1 airplane.
(B)With this graph,depict the point that would show the combination of 25 radios and 5 airplanes.
(C)With this graph,depict the point that would show the combination of 25 radios and 3 airplanes.
Correct Answer:
Verified
View Answer
Unlock this answer now
Get Access to more Verified Answers free of charge
Q101: Is it possible for an economy to
Q102: The movement from a point inside a
Q103: Exhibit 1-9 Q109: What explains the occurrence of increasing opportunity Q111: In a command economy, the what, how, Unlock this Answer For Free Now! View this answer and more for free by performing one of the following actions Scan the QR code to install the App and get 2 free unlocks Unlock quizzes for free by uploading documents![]()

