Use the Following Data for a Demand Curve Quantity Maximized? What Is the Elasticity at That Point
Use the following data for a demand curve. 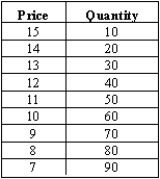
(A)Use the midpoint formula to calculate the elasticity between a price of $14 and $15.
(B)Use the midpoint formula to calculate the elasticity between $7 and $8.
(C)Because this is a linear demand curve,why does the elasticity change?
(D)At what point is price quantity maximized? What is the elasticity at that point?
Correct Answer:
Verified
View Answer
Unlock this answer now
Get Access to more Verified Answers free of charge
Q141: The concept that explains to what degree
Q149: A unit elastic supply curve is vertical.
Q155: If the producers of a product do
Q161: A manager wishes to increase revenues. One
Q164: Explain why economists care about the price
Q166: Minimum wage is a price floor because
Q167: Explain why a 10 percent tax would
Q169: The elasticity of demand is lower for
Q175: Given the following income elasticities of demand,would
Q179: Calculate the cross-price elasticity for the following
Unlock this Answer For Free Now!
View this answer and more for free by performing one of the following actions

Scan the QR code to install the App and get 2 free unlocks

Unlock quizzes for free by uploading documents