The table below shows the total costs of producing cherries on a small plot of land. 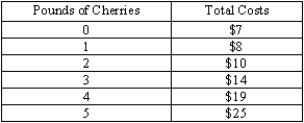
(A)Calculate the marginal cost schedule.
(B)Draw the farmer's supply curve.
(C)Suppose the price of one pound of cherries is $2.How much would this farmer produce? Show graphically the area of producer surplus.What are profits?
(D)Suppose the price of cherries goes up to $6 per pound.How much will the farmer produce now? What are profits now?
Correct Answer:
Verified
(B)
(C)
At $2 per pound,the farm...
View Answer
Unlock this answer now
Get Access to more Verified Answers free of charge
Q157: An increase in market demand has no
Q165: Explain the difference between profit and producer
Q166: The difference between producer surplus and profits
Q167: Which of the following formulas is not
Q168: What is the assumption of a competitive
Q171: Where does producer surplus get its name?
Q173: The table below shows the cost schedule
Q177: Suppose a firm's supply curve can be
Q181: Consider the information in the table below:
Q182: Refer to the table below.Find the fixed
Unlock this Answer For Free Now!
View this answer and more for free by performing one of the following actions

Scan the QR code to install the App and get 2 free unlocks

Unlock quizzes for free by uploading documents