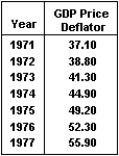
The figure below plots real and potential GDP between 1971 and 1977.Given the data in the corresponding table,can changes in the rate of inflation over this period be explained by the percent deviation between real and potential GDP? Do these data support or refute the validity of the assumptions about the IA line? 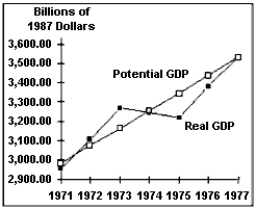
Correct Answer:
Verified
View Answer
Unlock this answer now
Get Access to more Verified Answers free of charge
Q150: If real GDP is greater than potential
Q157: Prices only change if real GDP moves
Q161: The intersection of the inflation adjustment line
Q166: Explain how expectations and the level of
Q168: The IA line will move up if
Q170: If firms and workers expect prices to
Q171: If firms are experiencing slow growth in
Q174: Historically, there has been a positive correlation
Q178: Explain why the inflation adjustment line is
Q179: According to historical evidence, when real GDP
Unlock this Answer For Free Now!
View this answer and more for free by performing one of the following actions

Scan the QR code to install the App and get 2 free unlocks

Unlock quizzes for free by uploading documents