The figure below shows the effect of a 2001 increase in government purchases on the hypothetical path of real GDP compared to the path of potential GDP (the baseline)between 2001 and 2005. 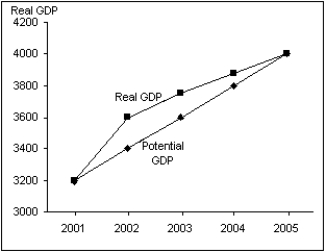 (A)Using the AD curve and IA line analysis,explain what is occurring between 2001 and 2002.
(B)Using the AD curve and IA line analysis,explain what is occurring between 2002 and 2004.
(C)Using the AD curve and IA line analysis,explain what is occurring between 2004 and 2005.
Correct Answer:
Verified
View Answer
Unlock this answer now
Get Access to more Verified Answers free of charge
Q61: Suppose the Fed engages in a policy
Q63: Which of the following descriptions best depicts
Q66: If the Fed raises interest rates because
Q70: According to the economic fluctuations model, what
Q72: What is the difference between deflation and
Q74: A fall in the overall price level
Q75: The long-run effect of a change in
Q78: Suppose the economy is initially at potential
Q79: If the Fed is worried about inflation
Q80: A temporary growth slowdown results in a
A)disinflation.
B)deflation.
C)boom.
D)fall
Unlock this Answer For Free Now!
View this answer and more for free by performing one of the following actions

Scan the QR code to install the App and get 2 free unlocks

Unlock quizzes for free by uploading documents