The table below shows the level of GDP per capita in 1900 for four regions of the world,as well as their growth rates between 1900 and 1938.Plot this table to determine whether catch-up is likely to occur among these regions.Does growth theory explain the growth experience of these regions between 1900 and 1938? 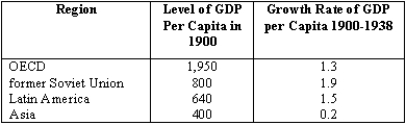
Correct Answer:
Verified
View Answer
Unlock this answer now
Get Access to more Verified Answers free of charge
Q41: Developing countries include all the following except
A)relatively
Q45: Which of the following is considered a
Q47: The percentage of the world population with
Q50: According to economic growth theory, what should
Q51: For the majority of people in the
Q52: An emerging market is a country that
A)became
Q53: Which of the following is not a
Q54: Have the predictions of growth theory proven
Q55: Economic development is
A)the branch of economics that
Q60: According to economic growth theory, how does
Unlock this Answer For Free Now!
View this answer and more for free by performing one of the following actions

Scan the QR code to install the App and get 2 free unlocks

Unlock quizzes for free by uploading documents