Suppose that each firm in an industry has total costs as shown in the following table. 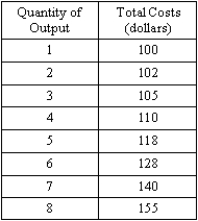 (A)Suppose that the quantity demanded in the market is perfectly inelastic at a quantity of 6.Calculate the average total cost for each firm when there are 1,2,and 6 firms in the industry.Draw a diagram indicating the relationship between average total cost and the number of firms.
(B)Suppose the quantity demanded in the market expands because of an opening of trade and is now perfectly inelastic at a quantity of 8.Draw a diagram,similar to the one in part (A),indicating the relationship between average total cost and the number of firms.Why does this opening of trade cause this shift in the curve?
(C)What happens to price in the long run? Explain.
Correct Answer:
Verified
View Answer
Unlock this answer now
Get Access to more Verified Answers free of charge
Q106: Was the rationale for the North American
Q124: The intersection of the export supply curve
Q125: Does comparative advantage occur only because of
Q126: A curve showing the quantity of imports
Q132: Explain whether the following statements are true
Unlock this Answer For Free Now!
View this answer and more for free by performing one of the following actions

Scan the QR code to install the App and get 2 free unlocks

Unlock quizzes for free by uploading documents