The following graph is a binomial distribution with n = 6. 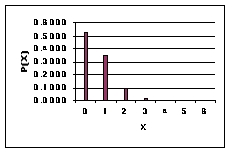 This graph reveals that ____________.
A) p > 0.5
B) p = 1.0
C) p = 0
D) p < 0.5
E) p = 1.5
Correct Answer:
Verified
Q8: In a binomial experiment, any single trial
Q14: Both the Poisson and the binomial distributions
Q15: Poisson distribution describes the occurrence of discrete
Q24: The following graph is a binomial distribution
Q25: You are offered an investment opportunity.Its outcomes
Q26: A market research team compiled the following
Q27: The number of successes in a hypergeometric
Q27: A market research team compiled the following
Q28: A market research team compiled the following
Q49: If x is a binomial random variable
Unlock this Answer For Free Now!
View this answer and more for free by performing one of the following actions

Scan the QR code to install the App and get 2 free unlocks

Unlock quizzes for free by uploading documents