For each menu item at a fast food restaurant, the fat content (in grams) and the number of calories were recorded. A scatterplot of these data is given: 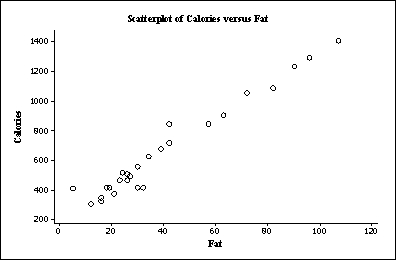 A plausible value for the correlation between fat content and number of calories is:
A) +0.2.
B) -0.9.
C) +0.9.
D) -1.0.
Correct Answer:
Verified
Q10: When water flows across farmland, some soil
Q11: The graph below shows a scatterplot of
Q12: A student wonders if people with similar
Q13: The volume of oxygen consumed (in liters
Q14: Which of the following statements is correct?
A)Changing
Q16: A scatterplot can be used to illustrate
Q17: A scatterplot of the amount of alcohol
Q18: The volume of oxygen consumed (in liters
Q19: A researcher measures the correlation between two
Q20: Does exposure to classical music (through instrument
Unlock this Answer For Free Now!
View this answer and more for free by performing one of the following actions

Scan the QR code to install the App and get 2 free unlocks

Unlock quizzes for free by uploading documents