For each menu item at a fast food restaurant, the fat content (in grams) and the number of calories were recorded. A scatterplot of these data is given: 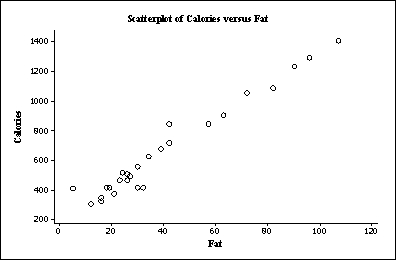 The restaurant decides to add six new high-calorie, low-fat pasta dishes to its menu. What is a plausible value for the new correlation coefficient describing the relationship between fat and calories?
A) +0.2
B) -0.2
C) +0.7
D) -0.7
Correct Answer:
Verified
Q21: Consider the following scatterplot of two variables
Q22: An economist conducted a study of the
Q23: An economist conducted a study of the
Q24: Which of the following statements is false?
A)Older
Q25: Frequent food questionnaires (FFQ) are a simple
Q27: An economist conducted a study of the
Q28: An economist conducted a study of the
Q29: An economist conducted a study of the
Q30: Consider the following scatterplot, which depicts the
Q31: An economist conducted a study of the
Unlock this Answer For Free Now!
View this answer and more for free by performing one of the following actions

Scan the QR code to install the App and get 2 free unlocks

Unlock quizzes for free by uploading documents