Investigators gave caffeine to fruit flies to see if it affected their rest. The four treatments were a control, a low caffeine dose of 1 mg/ml of blood, a medium dose of 3 mg/ml of blood, and a higher caffeine dose of 5 mg/ml of blood. Twelve fruit flies were assigned at random to the four treatments, three to each treatment, and the minutes of rest measured over a 24-hour period were recorded. Assume the data that follow are four independent SRSs (one from each of the four populations of caffeine levels) and that the distribution of the yields is Normal. 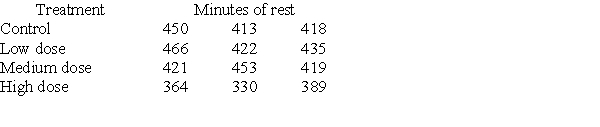 A partial ANOVA table produced by Minitab follows, along with the means and standard deviation of the yields for the four groups.
 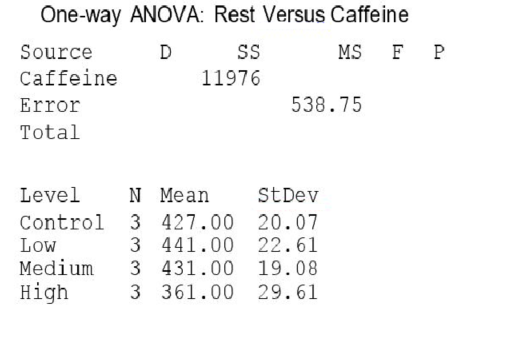 The P-value of this test is:
A) greater than 0.1.
B) between 0.05 and 0.1.
C) less than 0.05.
D) It is not possible to determine the P-value from the information provided.
Correct Answer:
Verified
Q1: A company runs a three-day workshop on
Q3: A company conducted an experiment to investigate
Q4: The test statistic F used in one-way
Q5: Which of the following is not a
Q6: At what age do babies learn to
Q7: At what age do babies learn to
Q8: A company conducted an experiment to investigate
Q9: The alternative hypothesis for the one-way analysis
Q10: Investigators gave caffeine to fruit flies to
Q11: Investigators gave caffeine to fruit flies to
Unlock this Answer For Free Now!
View this answer and more for free by performing one of the following actions

Scan the QR code to install the App and get 2 free unlocks

Unlock quizzes for free by uploading documents