The scatterplot below suggests a linear relationship between the age (in years) of an antique clock and its sale price (in euros) at auction. The data are age and sale price for 11 antique clocks sold at a recent auction. 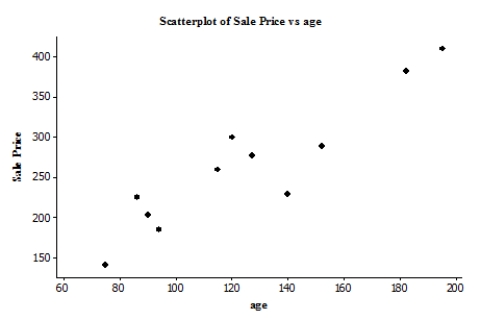 We fit the least-squares regression line to the model price = + (age) , where the deviations are assumed to be independent and Normally distributed, with mean 0 and standard deviation . A summary of the output is given. r2 = 0.848
S = 33.1559 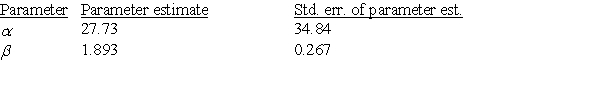 Suppose the researchers test the hypotheses H0: = 0, Ha: 0. The value of the t statistic for this test is:
A) -7.09.
B) 1.893.
C) 7.09.
D) 0.796.
Correct Answer:
Verified
Q1: You can visit the official website
Q2: Forced expiratory volume (FEV) is the volume
Q3: You can visit the official website
Q4: The following is a plot of the
Q5: Forced expiratory volume (FEV) is the volume
Q7: Forced expiratory volume (FEV) is the volume
Q8: You can visit the official website
Q9: Frequent food questionnaires (FFQs) are often given
Q10: Frequent food questionnaires (FFQs) are often given
Q11: A random sample of 19 companies
Unlock this Answer For Free Now!
View this answer and more for free by performing one of the following actions

Scan the QR code to install the App and get 2 free unlocks

Unlock quizzes for free by uploading documents